How to open the HAR file from Google Chrome
HAR files are useful when you need to share web requests with another developer, QA engineer, or support team. Google Chrome can record a HAR file from the Network tab, and Proxyman can open it again so you can inspect each request in a clean app.
In this short guide, we will record a HAR file from Google Chrome and open it with Proxyman.
1. What is the HAR file
HAR means HTTP Archive. It is a file format that saves network traffic from a browser session.
A HAR file can include:
- Request URLs
- HTTP methods, such as
GETandPOST - Request headers and response headers
- Status codes, such as
200,404, or500 - Timing information
- Response body content, if you export the HAR with content
This makes HAR very useful for debugging. For example, if a page is slow, a login request fails, or an API returns the wrong response, you can record a HAR file and send it to your teammate.
A HAR file may contain private data, such as cookies, tokens, email addresses, or API keys. Before you share it, make sure you trust the receiver and remove sensitive data if needed.
2. How to record it from Google Chrome
Google Chrome can export a HAR file from DevTools.
Follow these steps:
- Open the website in Google Chrome.
- Open DevTools.
- macOS:
Command + Option + I - Windows/Linux:
Ctrl + Shift + I
- macOS:
- Select the Network tab.
- Turn on the red record button if it is not already recording.
- Reload the page, or repeat the action that has the issue.
- Wait until the requests finish loading.
- Click the Export HAR button, or right click inside the Network table and select Save all as HAR with content.
- Save the
.harfile to your computer.
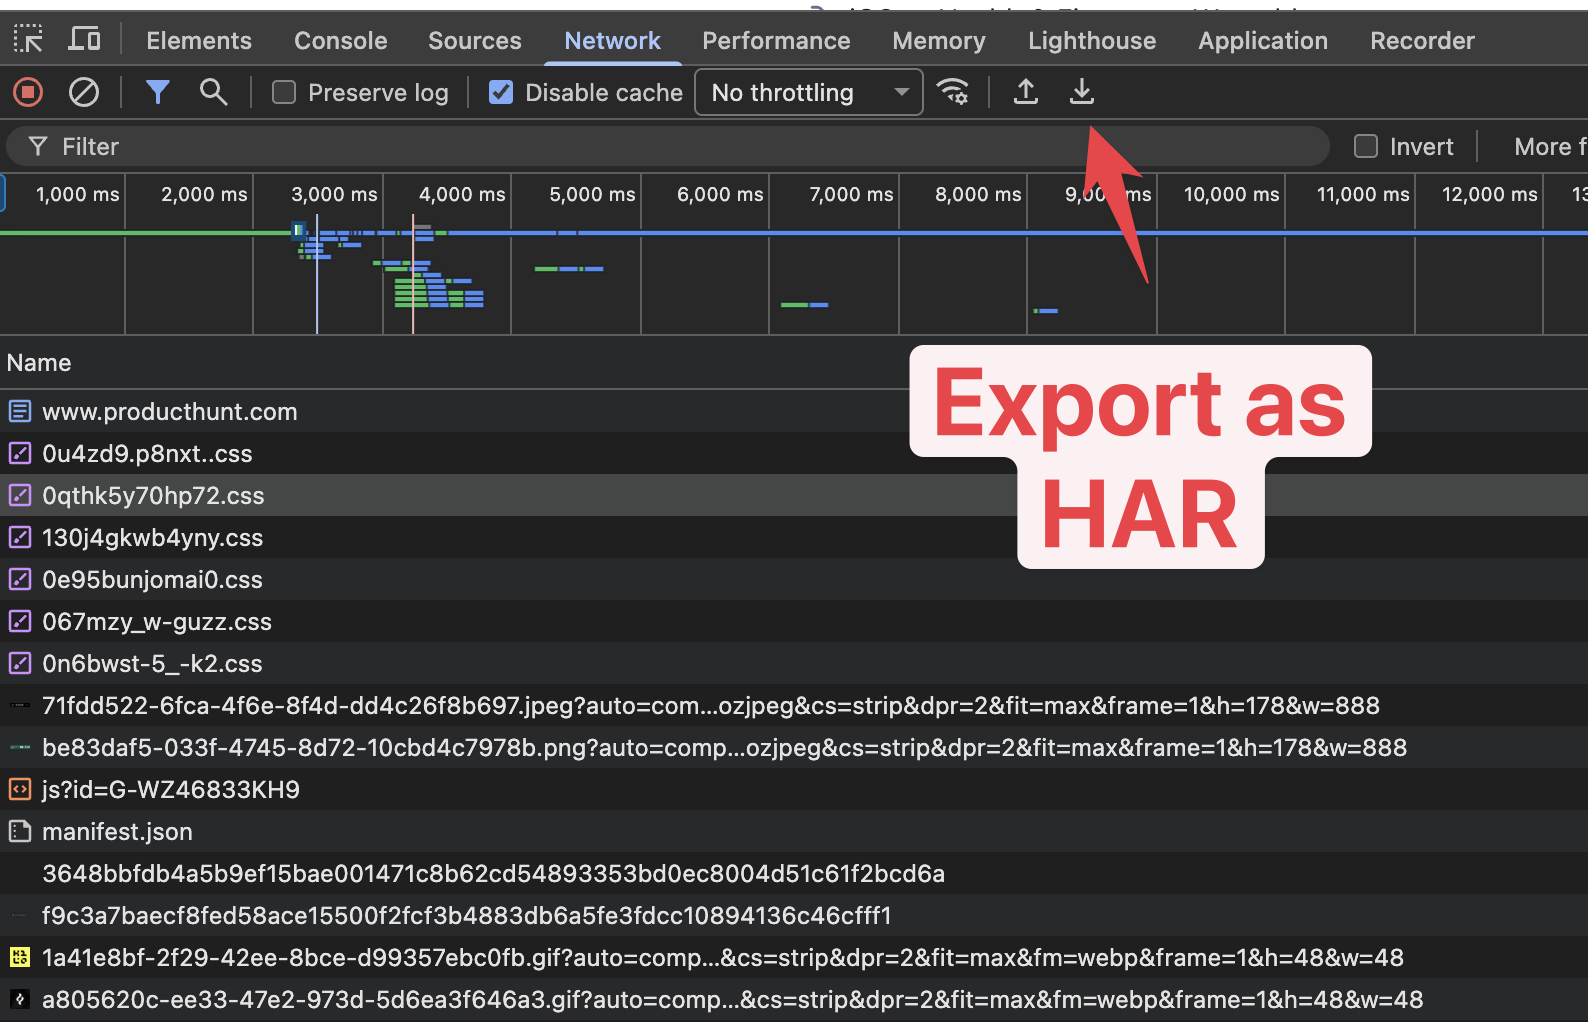
If you want the response body to be included, choose the option with content. This is helpful when your teammate needs to see the JSON response, HTML, or other body data.
3. How to open the HAR file
After you have the .har file, you can open it in Proxyman. Proxyman will import the requests and responses from the file, then show them in the main table.
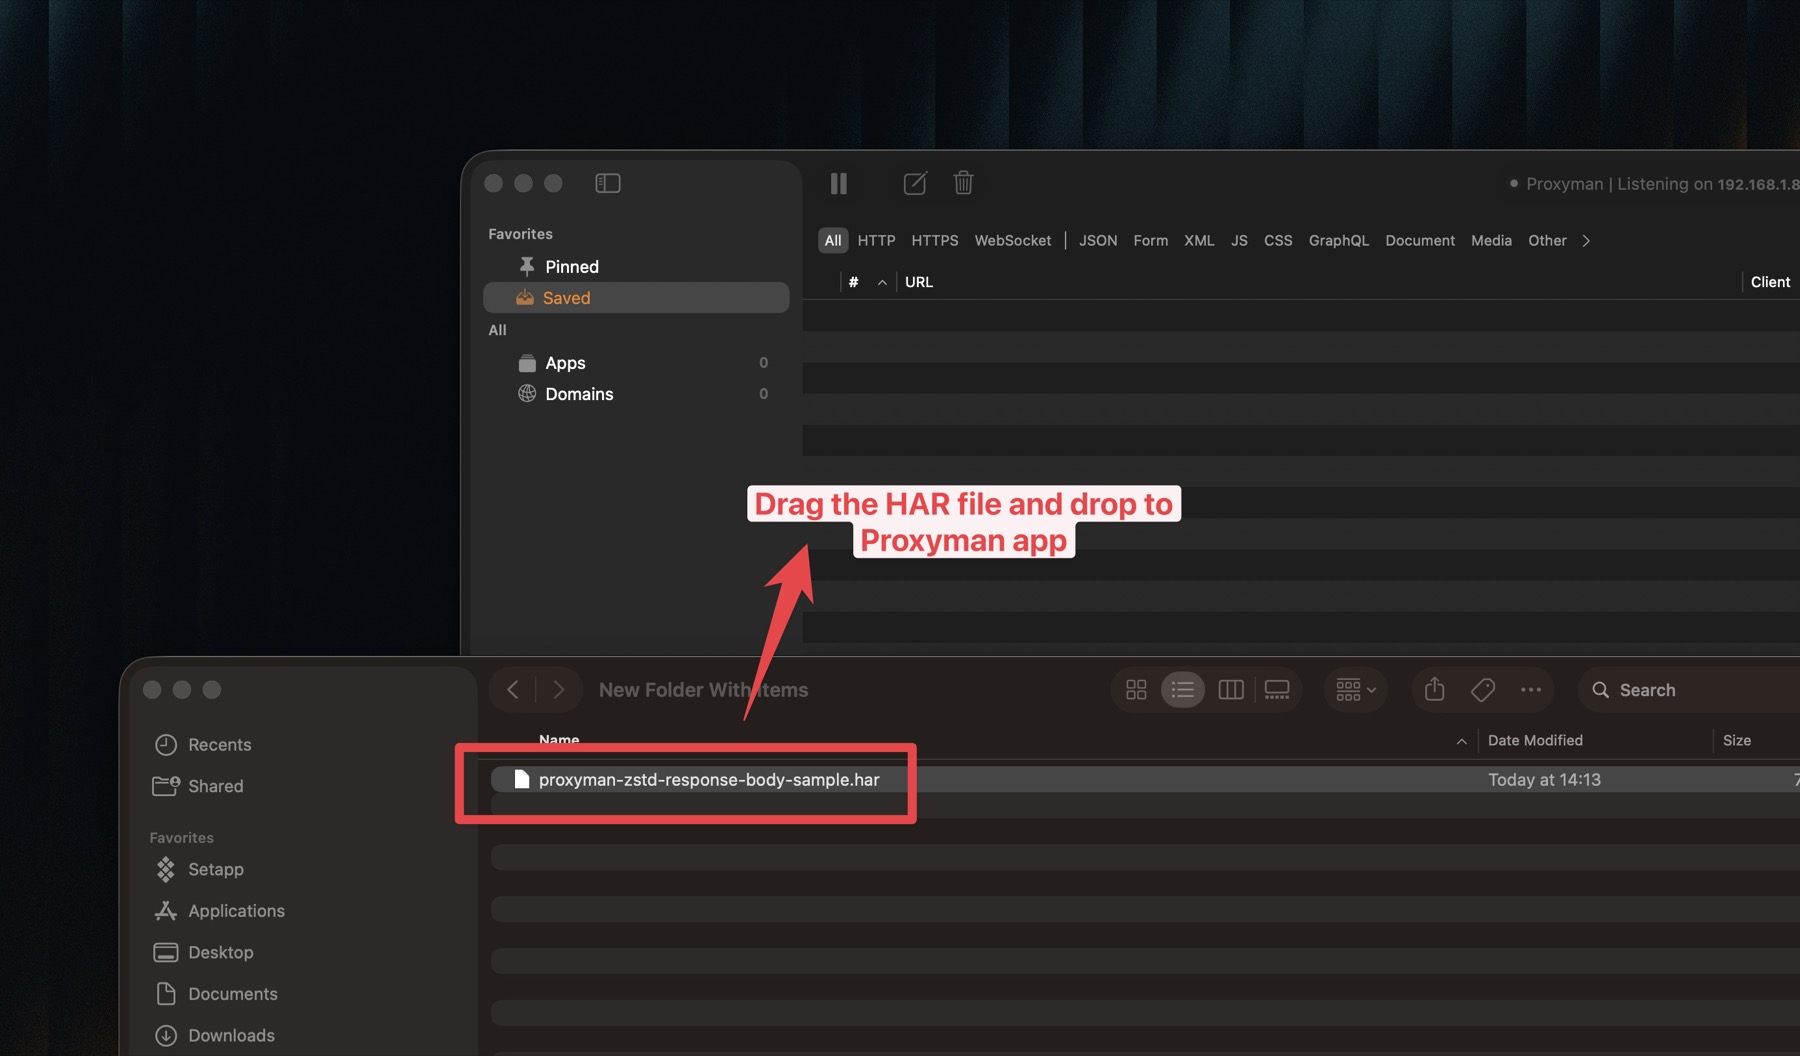
Option 1: Drag and drop the HAR file
This is the fastest way.
- Open Proxyman.
- Find the
.harfile in Finder or File Explorer. - Drag the file into the Proxyman window.
- Drop it on the main table.
Proxyman will load the HAR file and show the captured requests. You can click each request to inspect headers, query parameters, body, timing, and response content.
Option 2: Double click the HAR file
You can also open a HAR file by double click.
- Make sure Proxyman is installed.
- Find the
.harfile on your computer. - Double click the file.
- If your system asks which app should open it, choose Proxyman.
After that, the HAR file opens in Proxyman, and you can inspect the traffic like a normal captured session.
If double click does not open Proxyman, right click the file and choose Open With -> Proxyman. You can also set Proxyman as the default app for .har files on your computer.
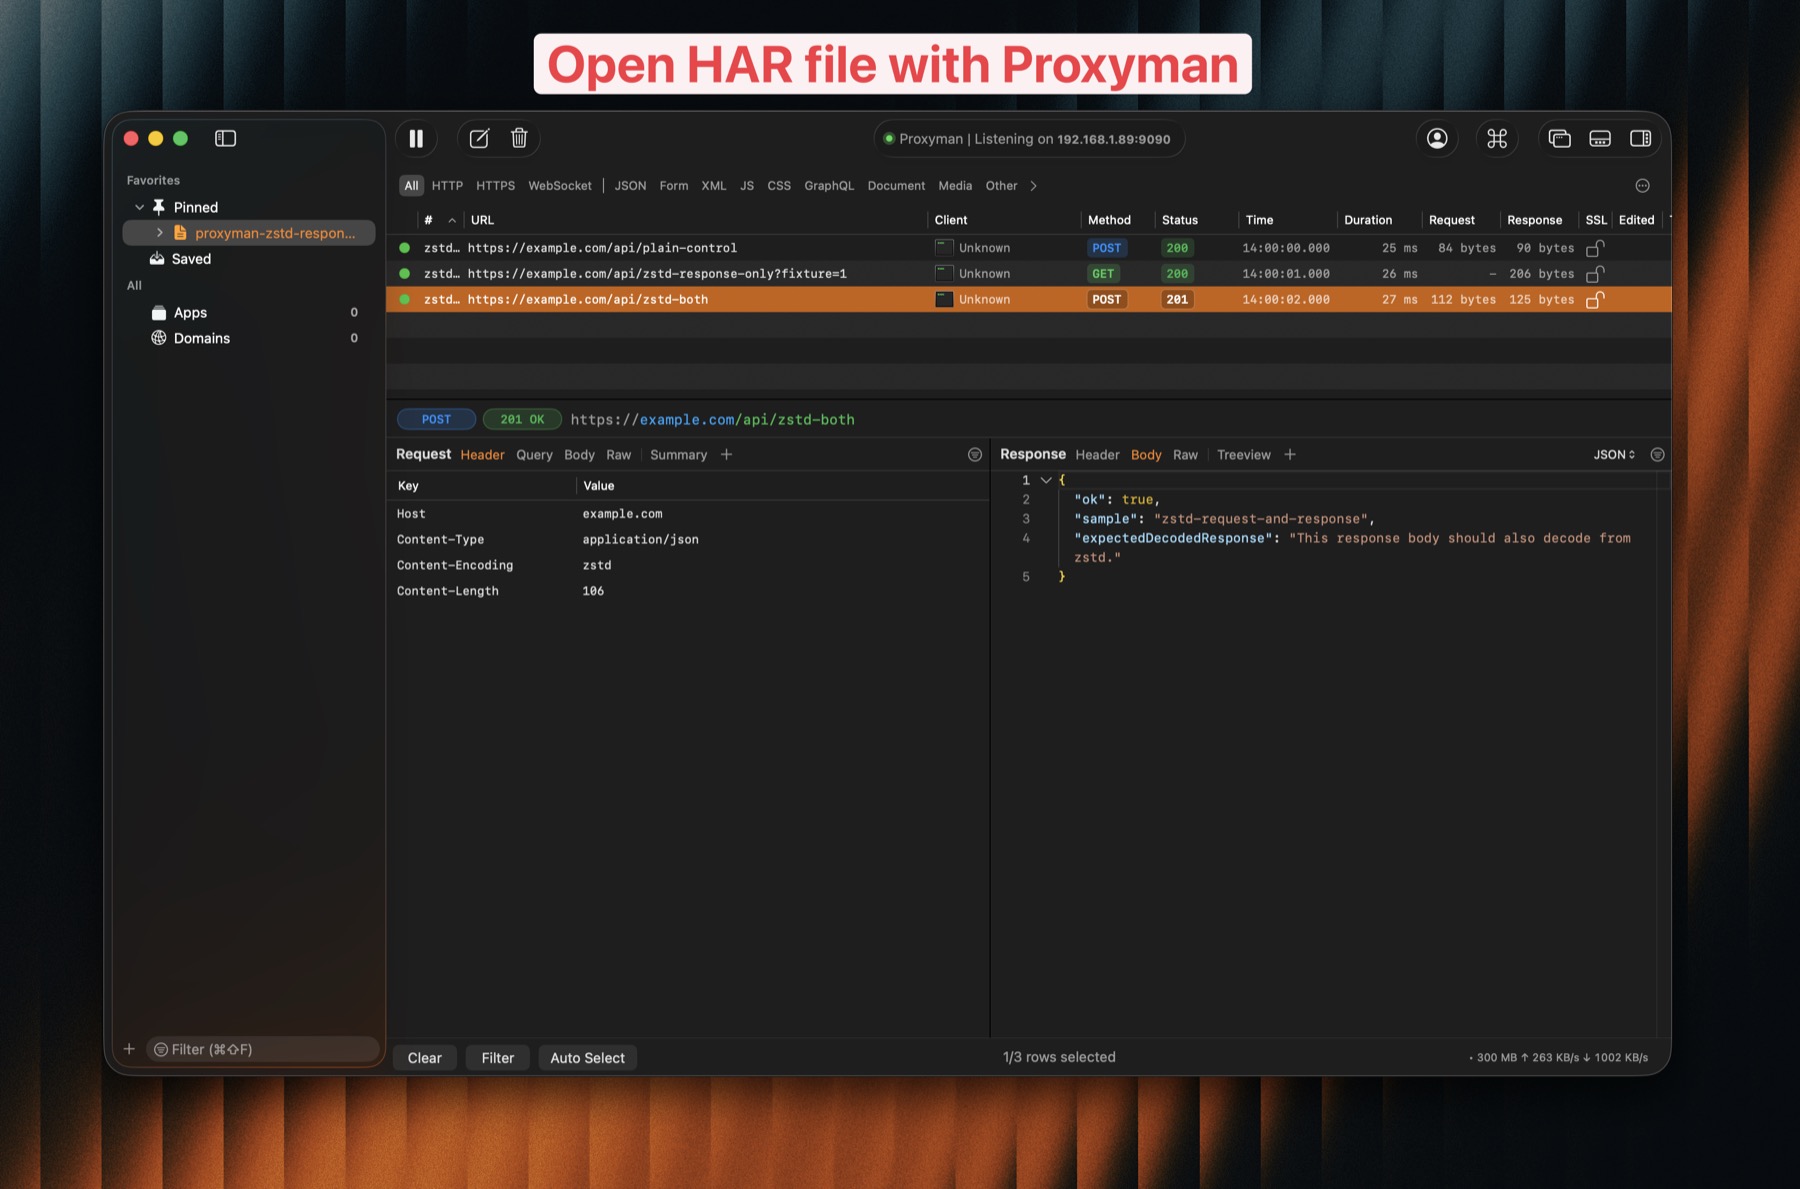
Inspect the HAR file in Proxyman
After Proxyman imports the HAR file, you can inspect it like normal captured traffic.
- Select a request in the main table.
- Check the Request tab to see headers, query, cookies, and body.
- Check the Response tab to see status code, headers, and response body.
- Use search or filters if the HAR file has many requests.
Start with failed requests first, such as 400, 401, 404, or 500. These requests often show the reason why the page or API did not work.
4. What's next
Now you can record a HAR file from Google Chrome and open it in Proxyman.
From here, you can:
- Search for a request by URL, host, or status code
- Check request and response headers
- Read JSON, HTML, images, and other response body content
- Compare a good request with a failed request
- Share the HAR file with your team for debugging
If the HAR file contains private user data, clean it before sharing. A small check can prevent leaking cookies, access tokens, or customer information.
For more Proxyman guides, visit the Proxyman Documentation or download Proxyman at https://proxyman.com.